Where Is All the Money Coming From? 💰
I usually check money supplies of the countries
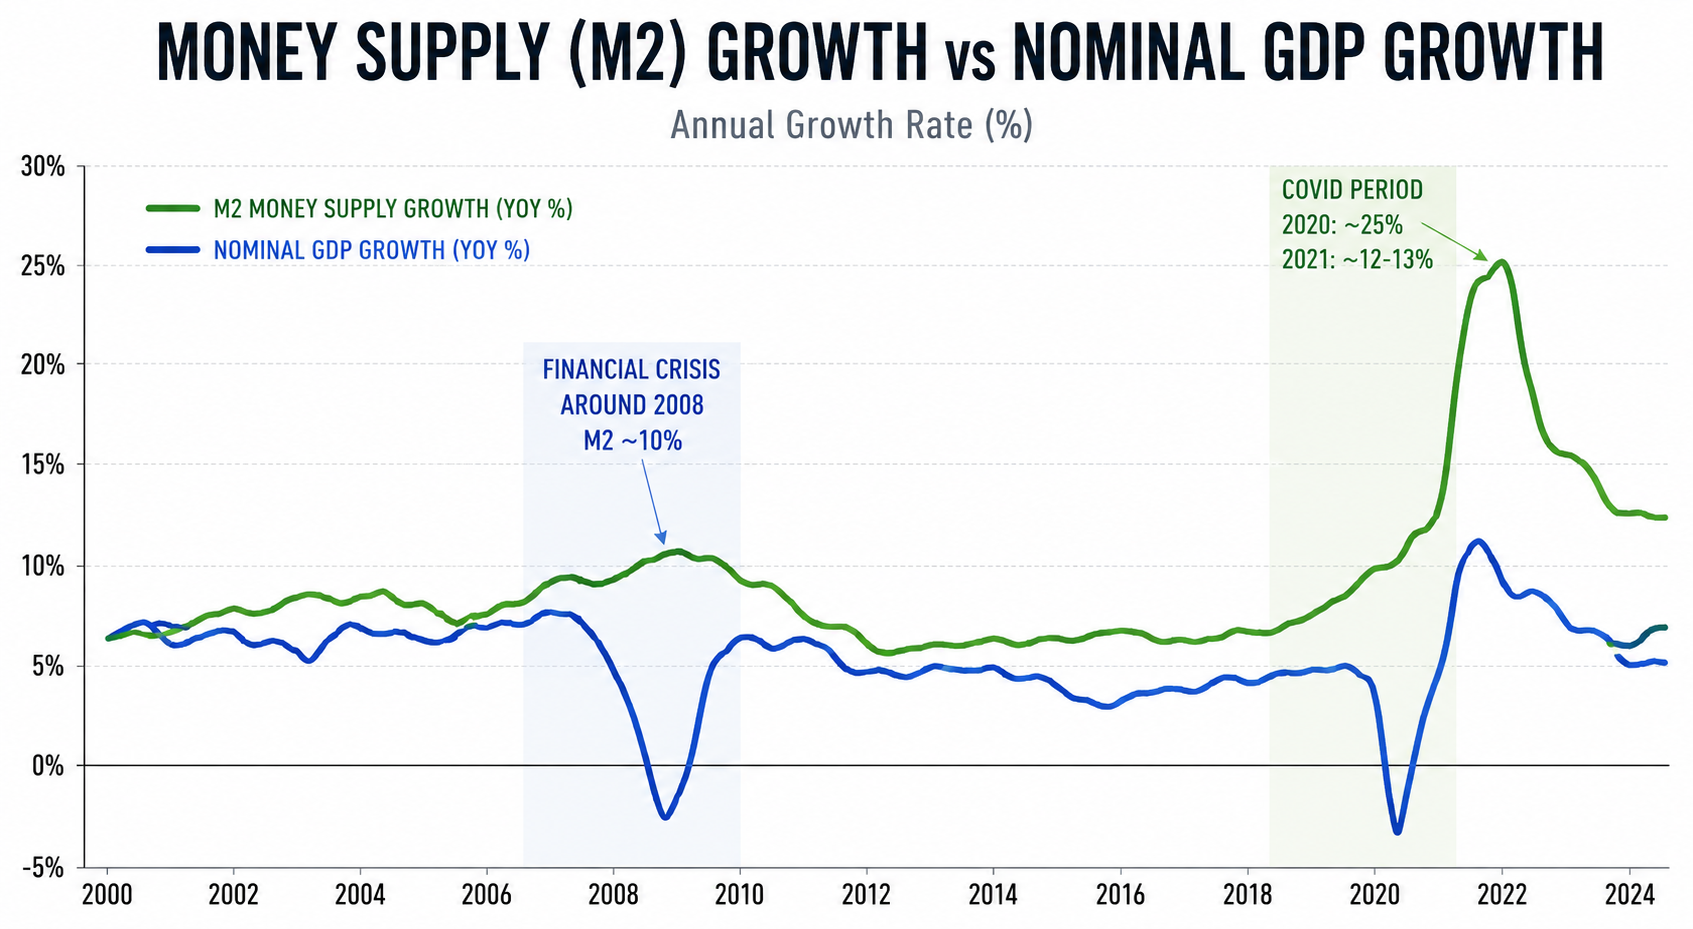
One number my economic brain is always interested in checking is the money supply of an economy, just to get a feeling for what direction the economy is heading. It is a pretty common measurement, although the exact definitions and categories vary between countries.
Generally, you will hear about measures such as M0, M1, M2, and M3.
- M0: generally consists of physical notes and coins in circulation.
- M1: generally includes M0 + assets such as currency and checking or current account deposits.
- M2: is broader and usually includes M1 plus savings deposits and certain other deposits.
- M3: is even broader but a lot of countries don’t publish it anymore.
When I look at these numbers I usually target M2.
These are pretty simple numbers, but they can tell you a lot about monetary conditions in an economy.
Understanding Money Creation 🏦
The simplest definition of M2 supply change is called money printing. Printing sounds weird because governments do not literally need to print physical money anymore, so let us just call it money creation. How much extra money is created overtime.
One important clarification here is that governments are not directly creating all of the money you see in M2. Central banks can create central bank money and strongly influence monetary conditions, while commercial banks also create deposit money when they make loans.
If you look at long term US M2 growth, something around 5 to 7 percent per year has historically been pretty normal, although it varies a lot depending on the period.
During crises, you can often see much higher growth because governments, central banks, and the banking system respond aggressively to weak economic conditions.
For example, US M2 growth reached roughly 10 percent around the financial crisis in 2008. The really crazy period, however, was COVID.
M2 money supply increased by around 25 percent in 2020 and another roughly 12 to 13 percent in 2021.
When you see money supply grow by double digits and you have an economy only growing low single digits that should already start to ring some bells in your head. When that happensOne of the obvious things that follows is high inflation,
The Liquidity Gap: M2 vs. Nominal GDP 📈
But what I am mostly interested in when I look at M2 is the current liquidity condition.
I like to compare M2 growth with nominal GDP growth.
This is not an official economic indicator. It is basically my own rough liquidity gap.
- If M2 is growing significantly faster than nominal economic activity, I see that as relatively loose liquidity conditions. There is relatively more money available compared with the amount of economic activity taking place.
- If nominal GDP is growing faster than M2, I see liquidity conditions as relatively tighter.
It basically gives me a rough idea of how quickly the pool of liquid money is expanding relative to the economy.
For example, after COVID, we had an extremely positive liquidity environment. Money was growing much faster than economic activity.
There was relatively more liquidity available.
The way my brain perceives this liquidity gap between money supply and GDP growth is that suddenly there is a bunch of new money available in the economy trying to find new owners.
Observations Around the World 🌍
China is especially interesting to me because its broad money supply has historically grown very quickly relative to many developed economies.
If money supply continues growing faster than nominal economic activity for long periods, I start asking questions about where that liquidity is going and how sustainable the economic model is.
I always question how long China can continue maintaining an economy that relies heavily on credit, investment, government support, and subsidies in certain sectors.
Then we have my beloved Georgia.
Georgia has had unusually high GDP growth over the past few years, but part of that growth has clearly been connected to the ongoing war between Ukraine and Russia.
After the war started, Georgia experienced a significant influx of migrants, money transfers, business activity, tourism, and spending power from the region, especially from Russia.
That does not mean all of Georgia’s economic growth came from the war but the external inflow has clearly been an important factor.
And this is where my economic brain starts asking questions.
What happens when the war is over?
What happens if a large part of those people eventually go back or move somewhere else?
What happens to the businesses, rents, consumption, tax revenues, and investment that benefited from that extra spending power?
And if our money supply continues growing quickly while some of these temporary sources of economic activity disappear, how are we going to make up for it?
It’s very hard to answer this question.
P.S. Quick one fact for all people.
You guys know that every time you borrow money from a bank, that money is most likely created at that moment?
You are not necessarily borrowing somebody else’s deposit.
When a commercial bank gives you a loan, it generally records a loan as an asset on one side of its balance sheet and creates a new deposit in your account as a liability on the other side.
Basically, commercial banks can create new deposit money when they lend.
Of course, they cannot create unlimited amounts of money. Banks are constrained by things like capital requirements, liquidity requirements, funding costs, regulation, credit risk and etc
But still, the basic idea is pretty crazy.
Banks can create money through lending.
I want to have that kind of power.